 This infographic by Carboun tells you everything you ever wanted to know about water and the Middle East but couldn’t be bothered to read
Building on the blossoming debate on water and its complexities and Carboun’s first infographic on the carbon emissions from the region, comes this second infographic which aims to decode the water situation in the Middle East and North Africa region. At first glance, it’s not as easy to read as Carboun’s previous infographic but this simply reflects the intricacy of the water situation in the Middle East.
The first you need to get your head around is the key. The percentage above all the water drops represents the amount of water a nation uses from the renewable resources available to it. So, if the percentage is 100% or less than that the country is using, respectively, all or less of its renewable resources but if this is over 100% than the country is using more water than it actually has which is clearly a bad thing.
Overused and Overstretched- Water In MENA
Unsurprisingly, it is the major oil-exporting nations that are blowing their water budget with Emiratis using a whopping 1600% more, Saudis using 951% of their available resources, Qataris using 624% and Libyans overusing water by 798%. Of the resource poor nations in the Middle East and North Africa region, Egyptians used 127%, Yemenis used 121% of their renewable water resources whilst Jordanians used 51% more water than was currently available to them at 151%. All of the remaining ‘resource-poor’ nations such as Syria, Iraq and Algeria used below their budget with Lebanon, which is known for its high water wastage, using the least at just 33% of its renewable water resources.
Getting The (Water) Balance Right
The infographic uses a water drop per nation to illustrate this balance of water consumption and water availability per capita. A dark blue outlines represents the water available and a light blue water drop represents the actual amount of water used – as such, any nation with a light blue water drop bigger than the outline means its overusing. Whilst any nation with a light blue water drop smaller/within the dark blue outline means it’s using water within its means. A quick glance at the infographic should help you make sense of all this.
Water Scarcity Impacting Resource-Poor & Resource-Rich Nations
Another useful bit of information which the infographic by Carboun, an organisation which promotes sustainability in the Middle East, includes is water scarcity. There is a water scarcity level line on the resource-poor nations which is quite hard to make out (maybe next time the line should be in black than light pink) which illustrates that many of the nations such as Tunisia and the Palestinian Territories are already dealing with water scarcity. Gulf nations such as Oman and Bahrain and also within the water scarcity level although unlike the poorer nations they are able to buy their way out of their problems with water desalination technologies.
Iran and Israel Still Missing
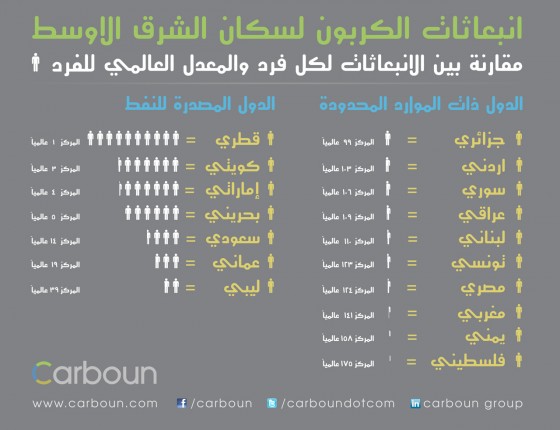
What’s also useful is that an Arabic version of the original infographic on carbon emissions has been produced which makes it a great resource for locals in the region. Again Israel and Iran are not included in this infographic so it’s good that Green Prophet recently published its own guide to Israel and water although the situation in Iran still needs to be highlighted. To find out more on Carboun see their website or follow them on twitter.
:: Data for the infographic via World Bank.
For more on water in the Middle East:
Trouble In Paradise: Water Failure At Luxury Apartments In Dubai
Syria Launches Water Scarcity Park
Israel Commits Itself To More Desalination
Iraqi Sheikh Threatens To Demonstrate If Kurds Don’t Share Water
Middle East Water Security Worries The Prince Of Jordan

Author: Arwa Aburawa
Arwa is a Muslim freelance writer who is interested in everything climate change related and how Islam can inspire more people to care for their planet and take active steps to save it while we can. She is endlessly suspicious of all politicians and their ceaseless meetings, especially as they make normal people believe that they are not part of the solution when they are the ONLY solution. Her Indian auntie is her model eco-warrier, and when Arwa is not busy helping out in the neighborhood alleyway garden, swap shopping or attempting fusion vegetarian dishes- with mixed success, she’d like to add- she can be found sipping on foraged nettle tea.


Agreeing with Karen here, and very interested in everything Arwa writes about water in the Middle East. Well done articles on a crucially important topic!
We need to produce our own infographics with Iran and Israel. Ignoring both these countries is like saying the world is still flat. Just shows how far stupid politics will drive people. I care about what’s happening in Iran, because I care about our planet, not one that has chunks of land annexed from it.